
3 Critical Website Metrics Most Businesses Are Failing to Track
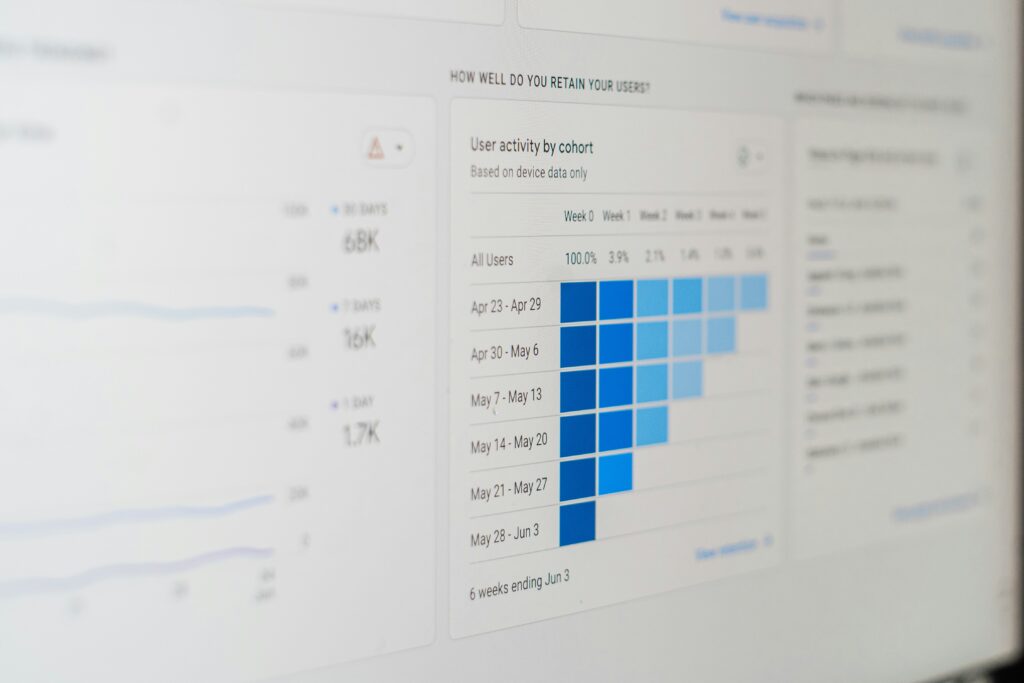
When we start work with a new client, one of our first questions is rarely about design. We ask what they actually measure. Most of the time the answer is traffic and page views, two numbers that feel important and change almost nothing about how the business runs.
We learned to look past those numbers properly while building an energy intelligence platform for a client whose entire value lies in getting insight in front of the right decision makers. Traffic alone would have told us almost nothing about whether that was happening. Three other website metrics did, and we now treat them as standard on every project.
Metric One: Form and Conversion Rate
Of everyone who reached a contact, quote or sign up page, how many actually completed it? Most businesses cannot answer that, because submissions arrive by email and nobody divides them by page visits.
On the energy platform, this mattered from day one because the entire commercial model runs on visitors becoming members. Rather than treating sign up as a single step, we tracked completion at each stage of the membership journey, from initial interest through to the Stripe payment. That let the client see precisely where interest was falling away, instead of only knowing that memberships were, or were not, coming through.
We have written more on this specific problem here: Why Website Forms Are the Most Neglected Part of Your Digital Strategy.
Metric Two: Event Based Engagement
Pageviews treat a three second visit and a ten minute read as the same thing. Event tracking in GA4 tells you what people actually did on a page: which sections they scrolled to, which research pieces they opened, which content they abandoned partway through.
For the energy platform, we mapped GA4 events across the full membership journey and paired that data with the client’s own existing customer database. That combination let us see how genuine subscribers behaved before they converted, rather than guessing from anonymous traffic patterns. We used those insights to shape a content visibility strategy aimed squarely at encouraging conversions, and the onboarding process became measurably smoother, with fewer support queries landing after launch as a direct result.
Google’s GA4 events documentation covers the mechanics well, but the harder and more valuable part is deciding which five or six events on your own site genuinely represent buying intent, rather than tracking everything and learning nothing.
Metric Three: Uptime and Real User Speed
The most expensive website failures happen when nobody is watching. If a site goes down at 2am on a Saturday, or a page takes eleven seconds to load on a mid range phone, no monthly traffic report will ever explain why enquiries quietly dipped that week.
We apply this same principle to every client with a high stakes page, not only the energy platform. One of our healthcare clients runs an online booking journey on their single highest traffic page, so we monitor its availability and load performance continuously rather than waiting for a patient to report a problem. The logic is identical to what we built for the energy platform: the page carrying the most commercial weight gets the closest watch, because a traffic report will never flag the outage that happened while nobody was checking.
Speed is also a ranking factor, which makes this the rare metric that pays twice over. We covered the tooling side of this in more depth here: 5 Must Have Monitoring Tools for 24/7 Website Uptime and Security.
What We Actually Recommend Clients Track
None of these three metrics needs an enterprise budget. Conversion rate is one calculation a month. GA4 events are free once configured with genuine thought behind which ones matter. Uptime monitoring costs less than a coffee a week.
What it takes is treating a website as a system that needs watching, the same way we approached the energy platform from the outset. Pick the three numbers, put them on one page, and review them monthly alongside traffic. Within a quarter, that combination will tell you exactly where a website leaks revenue, which is something page view data was never going to show you.
Do you know your form conversion rate right now? Active WebDezign sets up meaningful website metrics for businesses in London and across the UK, from GA4 event mapping to uptime monitoring and conversion tracking that ties back to revenue. Get a free analytics audit.

Write to us
or call the number 020 8446 1515